
Refundable Accommodation Deposits (‘RADs’) have jumped 16% in two years, outpacing both inflation and house prices. But those gains are far from even — where an aged care home is located and who runs it, now makes a real difference to what residents pay.
Over the past two years, the price of an aged care bed has quietly become one of the more dynamic numbers in Australian property. Refundable Accommodation Deposits – the lump sums residents pay for a bed – have risen 16% nationally, significantly ahead of both inflation and median house price growth. The cause is simple enough: demand is surging while very little new supply is coming online.
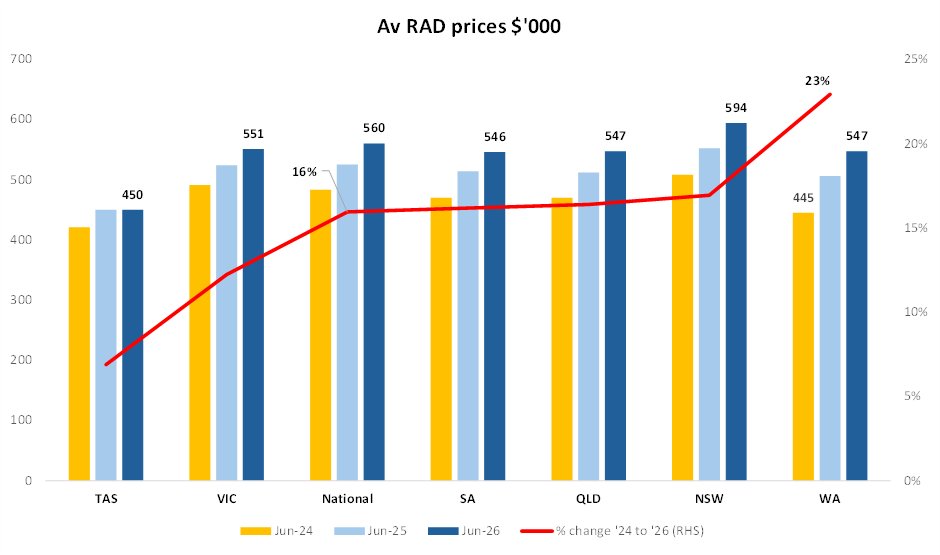
What is less obvious is how unevenly those gains are spread. RAD prices in Western Australia have climbed 23% in two years, while Tasmania has managed just 7%. Some providers have nudged prices up only slightly; others have pushed them hard. Increasingly, the number that matters is not the national average – it is what the provider down the road is charging.
Surging demand, stalled supply
The pressure is coming from both sides. In April 2026, Health Minister Mark Butler told the National Press Club that Australia needs to open a “new aged care facility every three days for the next 20 years” to keep pace with demand from an ageing Baby Boomer generation – and admitted the country is falling well short of that mark.
The numbers bear this out. Just 578 beds came online in the year to June 2025, according to analysis from Colliers and Boxwell & Co, whose late-2025 report described the supply shortfall as a crisis that will “get a lot worse”. Even the five-year average of around 1,400 beds a year is a fraction of the estimated 8,000 to 10,000 net new beds the sector needs annually.
The knock-on effects are showing up across the system:

Wait times are lengthening. The Government’s May 2026 Wait Times Report put the wait for ongoing Support at Home services at around 12 months.
Occupancy is high. Regis reported occupancy above 96% for the quarter ending 31 December 2025 in its H1 FY26 results.
Hospitals are backing up. A July 2025 report by Professor Stephen Duckett, commissioned by state and territory treasurers, found as many as one in ten public hospital beds are occupied by “stranded” patients waiting on aged care or supported disability accommodation. In June 2026 it was reported that 1,300 NSW hospital beds are occupied by medically cleared patients waiting for aged care or NDIS packages.
A step-change since January 2025
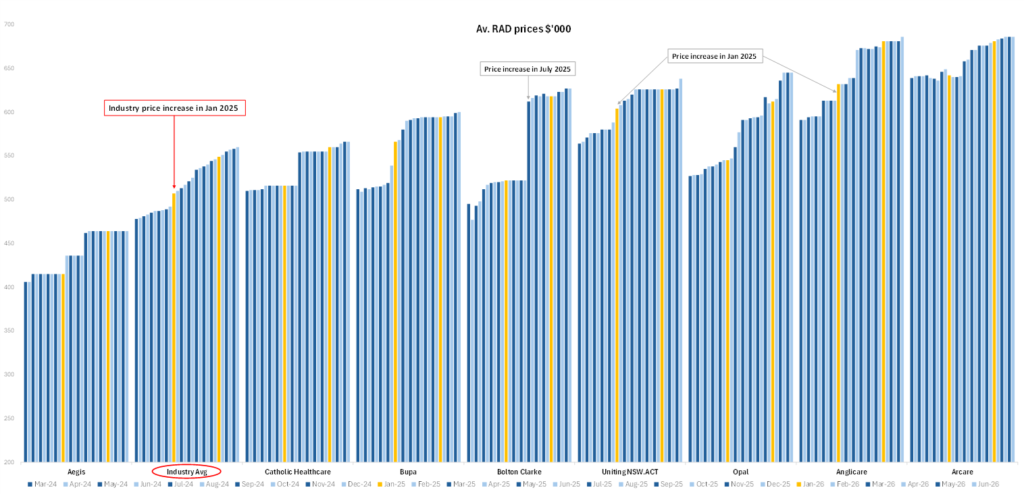
In January 2025 the IHACPA threshold for approving RAD prices without a separate application lifted from $550,000 to $750,000 and the effect was immediate.
Nationally, industry RAD prices rose by 16% since June 2024; the industry average moved from $483k to $560k over the two years.
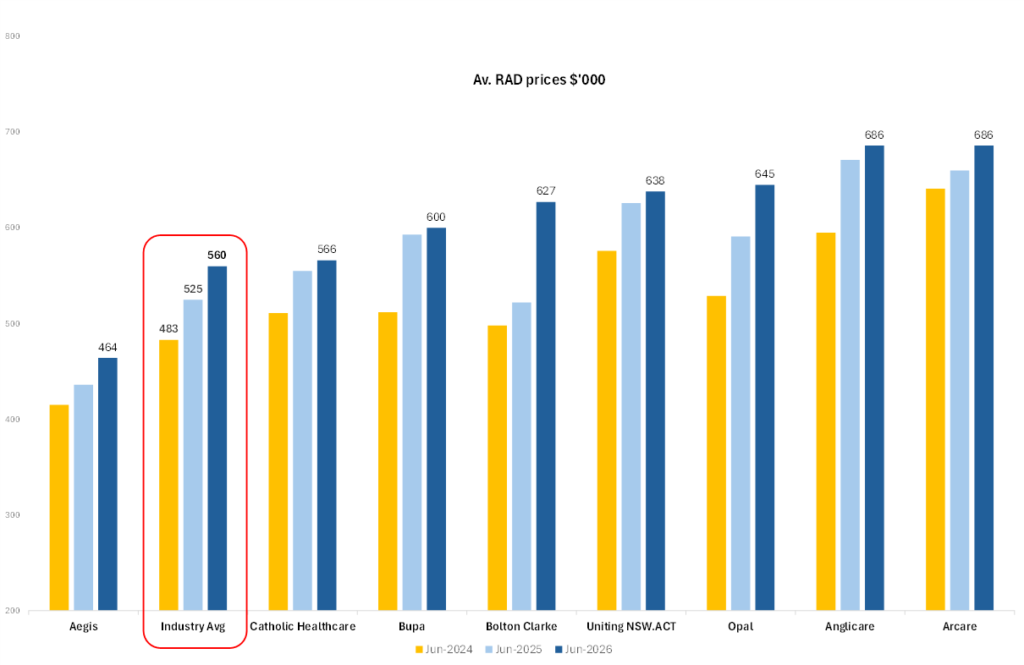
Plotting the same data month by month makes the January 2025 inflection point hard to miss: prices step up visibly across providers in the months that follow the threshold change.
The west leads, the map fragments
The headline growth story belongs to Western Australia. Two years ago, RADs there averaged $445,000 – among the lowest in the country. Today they sit at $547,000, a 23% jump that is the fastest of any state and now puts WA level with Queensland. A key driver is the state’s housing market: median house prices in WA have risen 17% in the past 12 months alone, according to realestate.com.au.
Zoom in further and the picture fragments again. Even within a single state, some regions have raced ahead while neighbours have barely moved. Brisbane RADs are up 28%, Adelaide City 33% and Wangaratta 22% over two years – yet Queensland, South Australia and Victoria each contain regions that have only seen modest increases over the same period: Port Douglas up just 6%, the Barossa 5% and Gippsland 6%.
Why local pricing now sets the ceiling
For years, the biggest handbrake on RAD pricing was occupancy; raise prices too far and rooms sat empty. That constraint has largely disappeared. With occupancy high and new supply scarce, operators are discovering that the real ceiling on what they can charge is simply what their local competitors are charging.
That shift changes the game for anyone valuing, financing or operating aged care assets. National averages and even state figures are now too blunt to be useful. In a market this fragmented, timely, detailed tracking of local RAD pricing is no longer a nice-to-have – it is the number that matters.
About the author
Harley Wright is the co-founder of Caring Data, a data company specialising in analytics for aged care, retirement living and SDA property. All data sourced from caringdata.com.au except where noted. He has been in the Aged Care and Retirement Living sector for more than 15 years.
Related Articles