A 12% rise in cranes across Brisbane’s skyline demonstrates that Australia’s fastest growing city is proactively responding to interstate migration, but cost experts at Rider Levett Bucknall (RLB) say capacity challenges lay ahead as major projects come online.
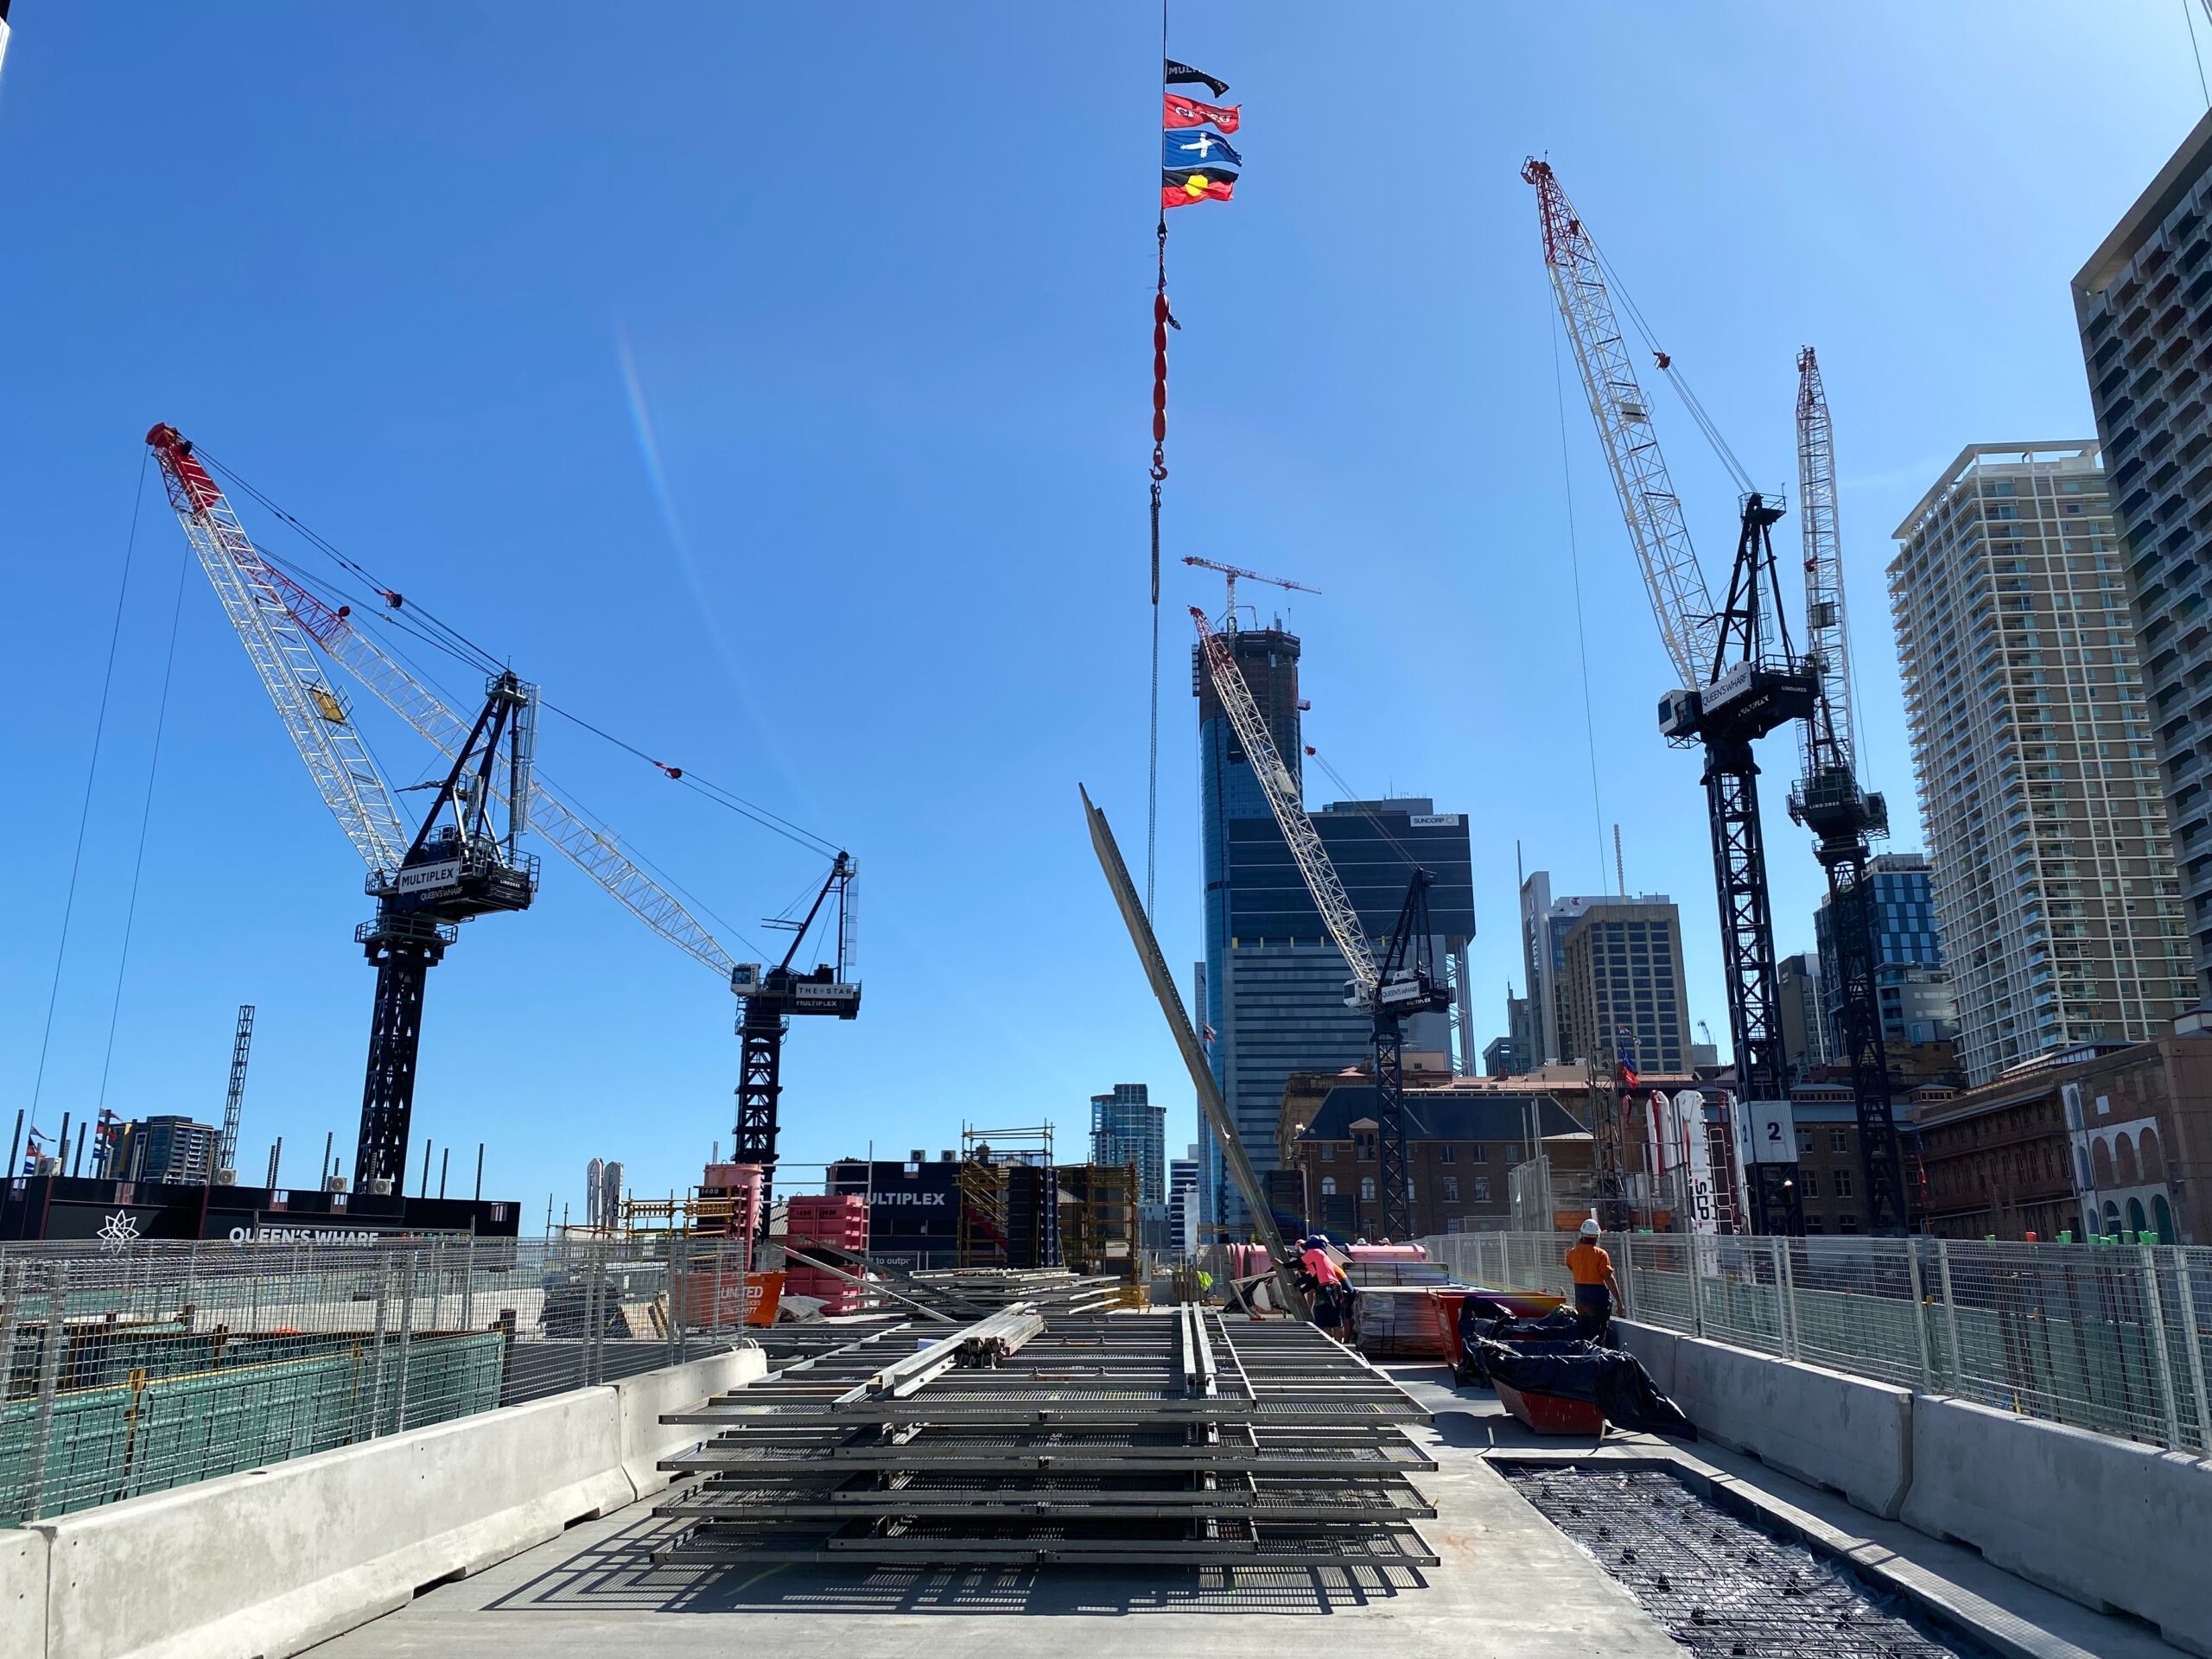
The 27th edition of the biannual RLB Crane Index® finds Brisbane’s skyline now hosts a total of 73 cranes, with 28 new additions outpacing the 20 removed since the last report in first quarter of 2025.
The Index has consistently tracked the number of cranes on sites since 2015, reflecting the level of primarily vertical construction across Australia.
RLB Queensland Director, Jamie Smith, said the latest results revealed the city was in a transitional phase before entering a new wave of expansion fuelled by the 2032 Olympic and Paralympic Games.
“With Brisbane on track to reach 3.1 million residents by 2032, the time to build housing is now, and this is reflected in Brisbane’s skyline where more than half of the cranes operating in the residential sector,” Mr Smith said.
“However, to reach the National Housing Accord’s target of 1.2M new homes over the next five years, we need to deliver 48,000 new residences annually across Queensland, which is well above the typical completions range of 30,000 to 35,000 homes.
Mr Smith said the challenge for Brisbane would be balancing the need for additional housing with the concurrent delivery of major projects in the pipeline, with the high-rise residential sector likely to feel the pinch.
“The primary hurdle is the volume of major projects,” he said. “We expect construction to ramp up with significant health projects and Olympics infrastructure coming online simultaneously, including the 2032 Olympic Village and new stadium at Victoria Park.
“Brisbane’s tier-1 builders are likely to shift their focus to these large-scale developments, which will put a strain on large-scale apartment and living sectors.”
The report revealed 42 residential projects, 7 mixed-use, 9 health and 5 civil projects were underway in Brisbane. Mr Smith recommended a balanced approach to meet this growing demand across sectors.
“It will be crucial to plan strategically to meet demand in Brisbane’s next phase of growth,” he said.
“This means mapping out public projects strategically to safeguard trade capacity and embracing modern methods of construction – like prefabricated components – to ease pressure on traditional trades and diversify the supply chain.”
CRANE ACTIVITY – AUSTRALIA BY KEY CITIES
24th Ed 25th Ed 26th Ed 27th Ed Q1 2024 Q3 2024 Q1 2025 Q3 2025 Adelaide 17 19 19 26 Brisbane 78 66 65 73 Canberra 26 30 22 12 Central Coast 12 17 14 13 Darwin 0 2 2 4 Gold Coast 61 62 59 67 Hobart 2 0 0 0 Melbourne 194 196 199 199 Newcastle 16 13 13 9 Perth 45 46 41 39 Sunshine Coast 16 14 18 13 Sydney 390 387 373 370 Wollongong 12 11 15 20 Australia 869 863 840 845


