Goodman released its results for the half year ended 31 December 2022 this week, delivering an operating profit of $877 million, up 11.5% on the first half of FY22, and operating earnings per security of 46.4 cents, up 10.7% on the same period last year.
While economic conditions vary globally, Goodman believes they are well placed with a strong capital position, an almost fully leased portfolio, and robust pipeline of development activity. As a result, the Group expects to achieve full year operating earnings per security growth of 13.5% compared to the previous guidance of 11%.
Group Chief Executive Officer, Greg Goodman said “Goodman Group’s continued strategy – to focus on high-quality properties in high barrier to entry infill locations – has produced strong results for 1H23. Despite the volatility in the global economic environment, we delivered a strong operating performance and financial results, and we expect this to continue into the second half of FY23.
We’ve seen continued rental growth in our markets which has underpinned strong cash flows. This is supporting valuation uplift and growth in assets under management, which was up 17% to $79.5 billion. Development activity remained strong, with WIP now at $13.9 billion, and should continue to be a source of growth for the Group and Partnerships.
We have remained disciplined in our capital management approach, maintaining our strong balance sheet with gearing at 9.7% and $2.8 billion of available liquidity across the Group. The Partnerships remain well funded with $18.1 billion of equity commitments cash and debt available across the platform.”
Commenting on the outlook, Greg Goodman said “The Group is in a strong position operationally and financially through the consistent execution of our strategy. Maintaining a strong balance sheet and retaining income provides significant liquidity and financial resources for growth and the ability to optimise returns in the current environment.
The distribution for FY23 is forecast to remain at 30.0 cents per security given the attractive opportunity to deploy retained earnings into investments and development inventory. The distribution forecast is also consistent with our preference to maintain gearing in the lower half of the Group’s Financial Risk Management policy range of 0-25%, in the near term.”
Key highlights for the period are:
Financial
- Operating profit1 of $877 million, up 11.5% on 1H22
- Operating EPS2 of 46.4 cents, up 10.7% on 1H22
- Statutory profit of $1,097 million (includes the Group’s share of valuation gains, non-cash items and derivative and mark to market movements)
- Gearing at 9.7%, (8.5% at 30 June 2022) (look through gearing at 20.7%)
- Available liquidity of $2.8 billion (excludes available equity commitments, cash and undrawn debt of $18.1 billion in Partnerships)
- Net tangible assets (NTA) per security of $8.87 per security, up 6% from 30 June 2022.
Operational
- Total assets under management (AUM) of $79.5 billion, up 17% on 1H22
- $1.4 billion of revaluation gains across the Group and Partnerships
- Portfolio occupancy remains high at 99.0% and like-for-like net property income (NPI) growth is 4.2%
- Development work in progress (WIP) up 9% on 1H22 to $13.9 billion, across 85 projects, with a forecast yield on cost of 6.4%
- Strong performance in GRESB and Sustainalytics benchmarks reinforcing substantial commitment to the Group’s sustainability targets.
Property investment – high occupancy and rental growth underpinning investment earnings
The strategic location of our portfolio has meant that demand for our properties has remained strong, with occupancy increasing to 99.0% and like-for-like net property income (NPI) growth of 4.2%. This, along with development completions, has resulted in increased property investment earnings, which are now $260.1 million (up 11% from 1H22).
Market rental growth has accelerated in most of our markets, driven by continued short supply and customers’ desire for better locations to improve efficiency. Consequently, rent reversion to market across our portfolio has continued to expand, despite a slowdown in economic activity.
Key highlights include:
- Occupancy increased to 99.0%
- Like-for-like NPI growth at 4.2%
- Leased 3.7 million sqm5 on a rolling 12-month period to 31 December 2022, equating to $484.4 million of annual rental property income
- On average, new leases are subject to higher annual reviews than the existing leases with a significant opportunity for income growth given the level of underrenting in the US, Australia, New Zealand, Europe and the UK
- Weighted average lease expiry (WALE) of 5.4 years, (up from 5.2 years at 30 June 2022). This continues to increase as developments are completed.
Development – WIP grows to $13.9 billion, with 99.8% leased on completion
Development earnings have increased 7% from 1H22 to $602 million. The volume of development work and production rate have both increased since the same time last year, as customers continue to look for sustainable, efficient properties, that are close to consumers and optimised to house their investments in automation and technology. As a result, 99.8% of the completed projects are leased.
Customers continue to seek to secure space in our development projects on long leases, with WALE for completed projects at 12.5 years and 15.7 years for commencements. The new leases, which typically have substantially longer terms than existing leases, are attracting higher structured rental increases throughout the term than previously.
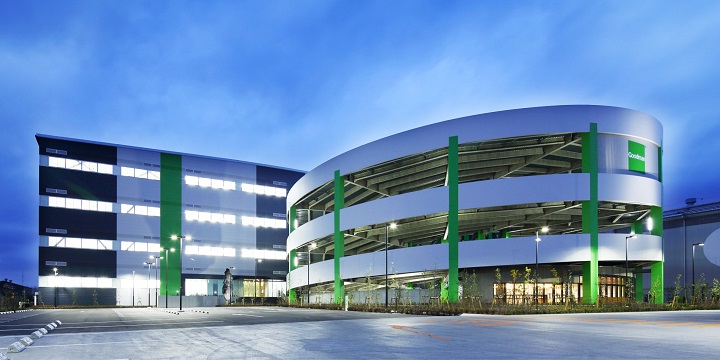
The value, scope and complexity of projects are increasing. We remain focused on regeneration of existing land and buildings, with more than 50% of our workbook on brownfield sites. Intensification is also occurring with the development of multi-storey projects which also make up more than 50% of WIP. These initiatives enhance value and reduce our impact on the environment.
Key highlights include:
- WIP of $13.9 billion with annual production rate at approximately $7 billion
- 85 projects in WIP in 12 countries, covering 3.9 million sqm
- Development yield on cost of 6.4% for projects in WIP, 6.3% for commencements
- Occupancy on completed projects of 99.8% and 81% of commencements are pre-leased
- WALE of 14.0 years for projects in WIP with 68% pre-committed.
Management – strong growth in AUM through ongoing development and revaluations
External assets under management are up 18% on 1H22 at $75.5 billion with growth primarily coming from development completions, valuations and acquisitions. The Partnerships completed $2.9 billion of acquisitions in the half, including sales from the Group to the Partnerships, and have $18.1 billion of equity commitments, cash and debt available, incorporating completion of equity raisings and a Partnership extension in the past six months.
To meet investor demand, two new partnerships were established in 1H23. Management earnings are up 3% on 1H22 to $264.7 million, driven by higher base fees and property service fees, with performance fees expected to be higher in the second half due to to the timing of payment.
Key management highlights include:
- External AUM of $75.5 billion, up 18% on 1H22
- Increasing number of Partnerships from 16 to 18
- Average Partnership gearing of 17.5%
- $18.1 billion available in equity commitments, cash and debt.
Environmental, social, governance – taking action
Goodman is determined to deliver tangible outcomes that will have a measurable and meaningful impact on the business, the environment and the wider community.
A key area is the reduction of carbon emissions, having had our science-based targets validated by the Science Based Targets initiative. Goodman is working with our customers and suppliers to help achieve our reduction targets. Our global solar installations and commitments are increasing, are expected to reach 264 MW in FY23, and we are on track to meet our 400MW target by 2025. We are also measuring the embodied carbon in our developments using a life cycle assessment (LCA) approach that creates carbon baselines which help us to identify reduction opportunities.
Key ESG highlights include:
- On track to reach 65% renewable electricity in use globally within Goodman’s direct operations in FY23
- Remain committed to being a Carbon Neutral Organisation as certified by Climate Active last year for our global operations
- Strong performance in Global Real Estate Sustainability Benchmark (GRESB). Goodman Group maintained its ‘A’ rating for its ESG disclosure and achieved high rankings for several Partnerships
- Maintained position as a top ESG performer by Sustainalytics, with an overall ESG risk rating of ‘Negligible’ ESG Risk
- The Goodman Foundation contributed $7.8 million to community causes in 1H23, including $121k raised directly by staff.
Outlook – Strategic locations support positive outlook
Commenting on the outlook, Greg Goodman said “The Group is in a strong position operationally and financially through the consistent execution of our strategy. Maintaining a strong balance sheet and retaining income provides significant liquidity and financial resources for growth and the ability to optimise returns in the current environment.
Customers across a wide range of sectors are seeking increased productivity from their supply chains. In addition, the ongoing growth in data storage is seeing data centres increasingly competing for space in our markets.
The general economic outlook is uncertain, however our portfolio is in high demand, rents are growing, development activity and margins are healthy, and we continue to attract capital from our Partners.
The Group expects to achieve full year OEPS growth of 13.5% compared to the previous guidance of 11%.
The distribution for FY23 is forecast to remain at 30.0 cents per security given the attractive opportunity to deploy retained earnings into investments and development inventory. The distribution forecast is also consistent with our preference to maintain gearing in the lower half of the Group’s Financial Risk Management policy range of 0-25%, in the near term.”
Goodman sets its targets annually and reviews them regularly. Forecasts are subject to there being no material adverse change in market conditions, or the occurrence of other unforeseen events.
Trading Chart
Disclaimer: The information contained on this web site is general in nature and does not take into account your personal situation. You should consider whether the information is appropriate to your needs, and where appropriate, seek professional advice from a financial adviser.


