
Australian Gross Domestic Product (GDP) rose 0.7 per cent in seasonally adjusted chain volume terms in the June quarter 2021, according to figures released by the Australian Bureau of Statistics (ABS) today.
Head of National Accounts at the ABS, Michael Smedes said: “Domestic demand drove growth of 0.7 per cent this quarter which saw continued growth across household spending, private investment and public sector expenditure. Lockdowns had minimal impact on domestic demand, with fewer lockdown days and the prolonged stay at home orders in NSW only commencing later in the quarter”.
Private demand contributed 1.0 percentage points to growth. Household spending increased 1.1 per cent and added 0.6 percentage points to growth, driven by spending on services which rose 1.3 per cent as COVID-19 restrictions continued to ease around Australia. Private investment rose 2.0 per cent and contributed 0.3 percentage points to growth. Dwelling investment increased for the fourth consecutive quarter, rising 1.7 per cent reflecting continued demand since the introduction of the HomeBuilder scheme. Housing activity continued to contribute to growth, ownership transfer costs rose for the fourth consecutive quarter, rising 10.0 per cent.
Public demand contributed 0.7 percentage points to growth, driven by continued investment in state and local infrastructure projects. Government spending rose 1.3 per cent driven by health related expenditure. Gross Value Added (GVA) for the Health industry rose 2.0 per cent.
Net trade detracted from growth driven by falls in exports of mining commodities reflecting disruptions to both coal production and transportation of iron ore to ports. Mining operating surplus rose 16.9 per cent, its third consecutive rise, reflecting strong commodity prices. The terms of trade rose 7.0 per cent in the quarter and 24.1 per cent through the year.
The household saving to income ratio fell slightly but remained elevated at 9.7 per cent, as household spending rose and household income fell. Compensation of employees rose 1.2 per cent as employment and hours worked increased with underlying activity in the economy. A fall in benefit payments detracted from income growth, reflecting a decline in the number of recipients and the winding back of additional COVID-19 support payments during the quarter.
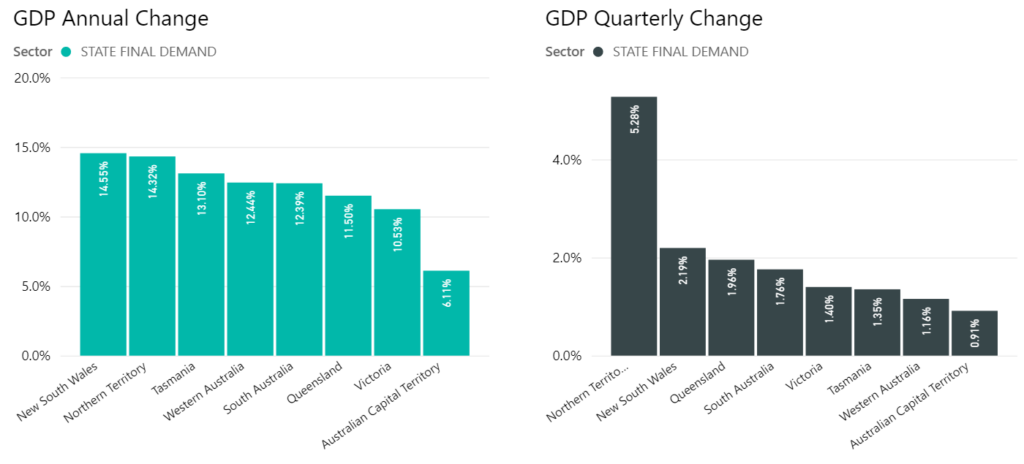
State by State GDP
On a State by State basis, an analysis of the latest GDP numbers reveal the extent of the COVID comeback across the country, with the Northern Territory showing the strongest gain over the quarter (due to substantial mining investments).
The GDP change on the same period last year is exceptionally high with an average increase of circa 11%, due predominantly to the significant drop experienced in Q2, 2020 due to COVID.
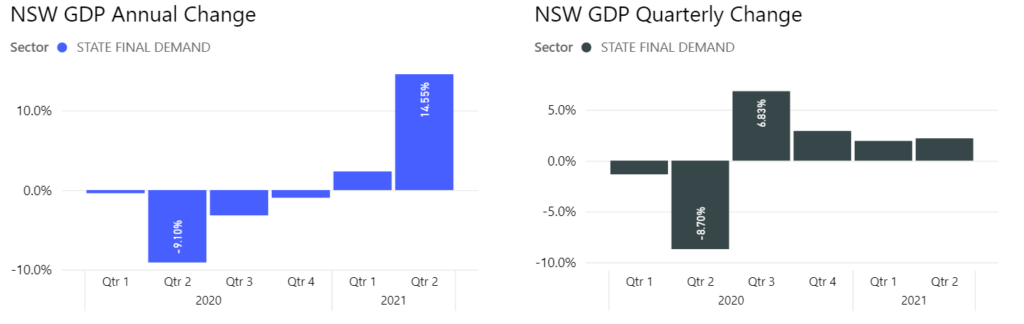
Total final consumption expenditure increased 1.9%, driven by a:
- 2.1% increase in household consumption, reflecting the continued recovery in expenditure on hotels, cafes and restaurants and recreation and culture aided by the state government’s Dine & Discover scheme. Stay-at-home orders currently in place in NSW came in to effect late in the quarter and did not have a major impact on household consumption in the June quarter.
- 1.6% increase in government consumption led by a rise in state and local employee expenses on front line services and the use of goods and services
Private gross fixed capital formation increased 2.6%, due to a:
- 7.3% increase in machinery and equipment investment reflecting increased purchases of vehicles and heavy machinery
- 7.5% rise in ownership transfer costs reflecting continuing strength in purchases of dwellings
- 1.1% increase in total dwellings driven by an increase in the construction of new dwellings
Public gross fixed capital formation increased 4.3%, driven by a:
- 3.8% increase in state and local general government reflecting an increase in investment in health and education buildings, as well as on-going work on road infrastructure projects
- 8.8% increase in state and local public non-financial corporations led by on-going investment into rail infrastructure
Total final consumption expenditure increased 0.6%, due to a:
- 1.8% increase in government consumption due to an increase in expenditure on Commonwealth social benefits to households and the use of goods and services by state and local government
- 0.1% increase in household final consumption expenditure as an increase in lockdown days in the June quarter compared to the preceding March quarter subdued growth.
Private gross fixed capital formation increased 1.4%, driven by a:
- 18.5% increase in ownership transfer costs reflecting increased housing market activity
- 3.2% increase in machinery and equipment reflecting increased purchases of equipment and vehicles
Public gross fixed capital formation increased 13.2%, driven by a:
- 21.4% increase in state and local general government reflecting increased investment in road and rail infrastructure and health related projects, as well as larger second-hand asset transfers from the private sector

Total final consumption expenditure increased 1.0%, driven by a:
- 2.0% increase in government expenditure led by strength in employee expenses within state and local government for Education and Health
- 0.7% increase in household final consumption expenditure driven by increased spending on hotels, cafes and restaurants and operation of vehicles reflecting strong tourism spending
Private gross fixed capital formation increased 5.7%, due to a:
- 8.7% increase in total non-dwelling construction reflecting increased expenditure on offices, accommodation and entertainment related buildings
- 7.4% increase in machinery and equipment led by increased equipment purchases by the mining industry and vehicle purchases
- 2.3% increase in dwelling investment in new houses following increased approvals supported by the HomeBuilder scheme
Public gross fixed capital formation increased 2.9%, due to a:
- 5.1% increase in state and local general government investment in road and rail infrastructure
Partly offset by a:
- 7.1% decrease in state and local public non-financial corporations as a result of reduced work carried out on utility projects

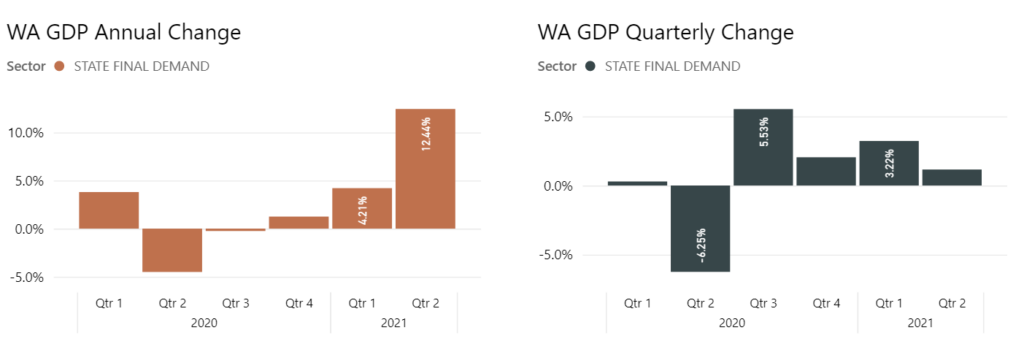
Total final consumption expenditure increased 1.1%, due to a:
- 1.9% increase in household consumption driven by the normalisation of electricity, gas and other fuels following the completion of the state government household electricity credit scheme and transport services
Partially offset by a:
- 0.9% decrease in government consumption driven by state and local following the cessation of the state’s electricity credit scheme
Private gross fixed capital formation decreased 0.5%, due to a:
- 5.4% decrease in total non-dwelling construction driven by a decline in new-engineering construction from the mining industry
- 3.0% decrease in ownership transfer costs following very strong growth in prior quarters.
Partially offset by a:
- 4.5% increase in machinery and equipment driven by increased investment in vehicles and heavy machinery by the mining industry
- 4.5% increase in total dwellings driven by strength in both new houses and alterations and additions.
Public gross fixed capital formation increased 11.7%, driven by a:
- 14.0% increase in state and local general government reflecting the commencement of new road projects.
- 12.9% increase in state and local public non-financial corporations due to ongoing work on rail infrastructure
Total final consumption expenditure increased 0.9%, driven by a:
- 0.6% increase in household final consumption expenditure led by increased expenditure on electricity, gas and other fuels due to cooler weather conditions, and an increase in the purchase of vehicles
- 1.6% increase in government final consumption expenditure driven by increased Commonwealth expenditure on social benefits to households and state and local government consumption expenditure
Private gross fixed capital formation increased 2.3%, driven by a:
- 4.0% increase in total dwelling construction as the HomeBuilder scheme supported increased investment in alterations and additions
- 3.0% increase in non-dwelling construction, reflecting greater investment in new engineering construction
Public gross fixed capital formation increased 12.9%, driven by a:
- 19.9% rise in state and local general government, reflecting the continued high investment in education infrastructure and commencement of major road projects
Total final consumption expenditure increased 1.0%, due to a:
- 0.9% increase in household final consumption expenditure led by increased expenditure on furnishings and household equipment and purchase of vehicles
- 1.2% increase in government final consumption expenditure driven by increased consumption across national and state and local governments
Private gross fixed capital formation increased 1.1%, driven by a:
- 13.0% rise in total non-dwelling construction reflecting increased investment in new engineering construction
Partially offset by a:
- 6.4% decrease in machinery and equipment driven by falls in heavy equipment and vehicle purchases following strong investment in previous quarters
Public gross fixed capital formation increased 6.6%, driven by a:
- 8.8% rise in state and local general government with continued work on road projects and elevated investment in health and justice facilities
- 7.7% rise in state and local public non-financial corporations led by a rise in electricity infrastructure investment
Total final consumption expenditure decreased 0.3%, driven by a:
- 2.6% decrease in government final consumption expenditure led by a decrease in both employee expenses and use of goods and services by state and local government
Partially offset by a:
- 1.6% increase in household final consumption expenditure driven by recreation and culture, transport services and hotels, cafes and restaurants reflecting increased tourism activity
Private gross fixed capital formation increased 37.7%, due to a:
- 105.2% increase in non-dwelling construction due to increased investment by the mining industry
- 29.0% increase in intellectual property products reflecting increased expenditure on exploration
- 10.3% increase in machinery and equipment led by the mining industry
Public gross fixed capital formation increased 9.9%, driven by a:
- 10.1% increase in state and local general government due to increased investment in road projects
- 26.8% increase in state and local public non-financial corporations reflecting the recovery in investment within the electricity sector as COVID restrictions in prior quarters heavily reduced activity
Total final consumption expenditure increased 0.8% driven by a:
- 1.3% increase in household final consumption expenditure led by the continued recovery in expenditure on hotels, cafes and restaurants and an increase in the purchase of vehicles by households
- 0.4% increase in government final consumption expenditure due to an increase in use of goods and services by state and local government in response to the COVID-19 vaccine rollout
Private gross fixed capital formation increased 2.4%, driven by a:
- 31.0% increase in machinery and equipment investment led by purchases of vehicles and computer equipment
- 9.9% increase in total non-dwelling construction reflecting increased investment in new buildings
Public gross fixed capital formation increased 0.4%, driven by a:
- 12.5% increase in state and local general government due to increased investment in hospital and road projects
- 5.1% increase in national general government led by increased defence investment
Related Articles


