Australian Gross Domestic Product (GDP) rose 0.9 per cent in seasonally adjusted chain volume terms in the June quarter 2022 and was up 3.6 per cent through the year, according to figures recently released by the Australian Bureau of Statistics.
Sean Crick, head of National Accounts at the ABS, said: “Rises in household spending and exports drove growth in the June quarter. This is the third consecutive quarter of economic growth, following a contraction in the September quarter 2021, which was impacted by the Delta outbreak.”
Household spending rose 2.2 per cent for the quarter, contributing 1.1 percentage points to GDP. Growth was driven by spending on travel related categories such as transport services (up 37.3 per cent) and hotels, cafes and restaurants (up 8.8 per cent), while spending on food fell 1.2 per cent.
“Households increased spending on domestic and international travel as COVID restrictions further eased and international borders remained open. While spending on transport grew strongly, households were still only spending two thirds of what they did pre-pandemic,” Mr Crick said.

Increased travel activity by both households and business was reflected in increased Gross Value Added for the Accommodation and Food Services, and Transport, Postal and Warehousing industries.
The household saving to income ratio fell for the third consecutive quarter, from 11.1 per cent to 8.7 per cent, as the increase in household spending outpaced growth in household income. “Households were continuing to save but at a declining rate over the past three quarters. While the 8.7 per cent household saving ratio was the lowest since the start of the COVID-19 pandemic, it remains above pre-pandemic levels,” Mr Crick said.
Strength in compensation of employees (up 2.4 per cent) drove a 1.0 per cent increase in household gross disposable income. This is consistent with growth in employment in Labour Force, Australia. The number of employed persons rose 0.9 per cent over the quarter, driven by growth in full-time employment (up 2.3 per cent).
Total dwelling investment fell 2.9 per cent as wet weather across much of the east coast and continued material and labour shortages hampered construction activity. This detracted 0.1 percentage points from GDP.
Net trade contributed 1.0 percentage points to GDP, driven by exports, which rose 5.5 per cent, which was partially offset by imports increasing 0.7 per cent.
“Exports recorded the strongest quarterly rise since the Sydney Olympics boosted travel exports in September quarter 2000,” Mr Crick said. Goods exports rose 4.2 per cent, with the main contributors being mineral ores, other mineral fuels and rural goods. Services exports rose 13.7 per cent, driven by travel and transportation services, as international borders were open for the full quarter.
The terms of trade rose 4.6 per cent with export and import prices up strongly for a second quarter in a row. Ongoing supply chain issues and global uncertainty continued to drive demand for Australia’s mining and rural commodities. High commodity prices coupled with increased export volumes drove a 16.9 per cent increase in Mining operating surplus in June to $83 billion.
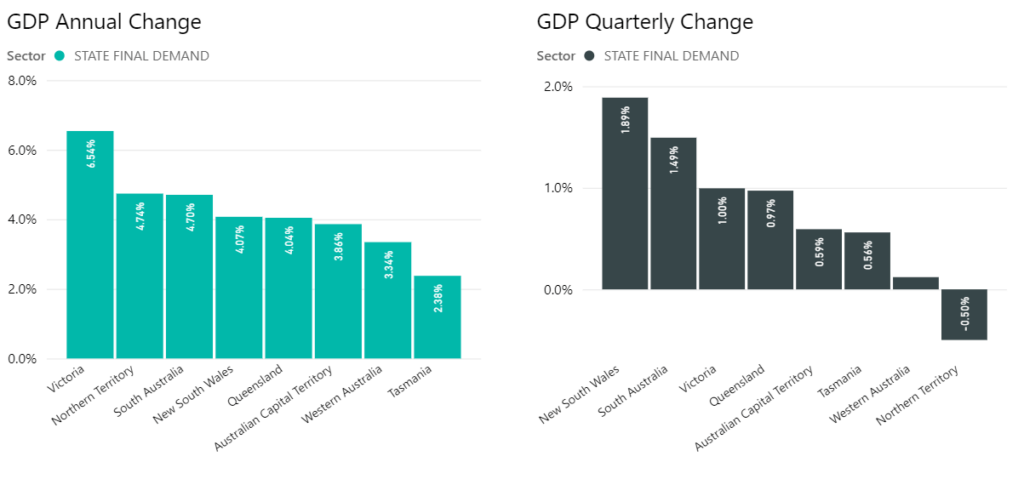
On a State by State basis, an analysis of the latest GDP numbers reveal the extent of the COVID comeback across the country, with the Northern Territory showing the strongest gain over the quarter (due to substantial mining investments).
The GDP change on the same period last year is exceptionally high with an average increase of circa 11%, due predominantly to the significant drop experienced in Q2, 2020 due to COVID.
Total final consumption expenditure increased 1.5%, driven by a:
- 2.5% increase in household consumption. Leading the rise were hotels, cafes and restaurants (10.9%), transport services (35.6%) and recreation and culture (2.8%) reflecting increased spending on discretionary and tourism related services. Electricity, gas and other household fuels also increased (10.4%) contributing to the rise.
Partly offset by a:
- 1.0% decrease in government spending, driven by a fall of 1.2% in state and local expenditure.
Private gross fixed capital formation increased 1.5%, due to a:
- 9.0% increase in machinery and equipment due to increased spending from the retail, construction and agriculture industries.
- 1.5% increase in non-dwelling construction led by strength in new building construction.
Partly offset by a:
- 7.7% decrease in ownership transfer costs due to a slow down in the residential property market.
Public gross fixed capital formation increased 8.7%, driven by a:
- 8.0% increase in general government led by a rise in state and local expenditure (6.5%) with increased investment into buildings and transport infrastructure.
- 11.0% increase in public corporations led by Commonwealth investment into national utility and transport infrastructure.

Total final consumption expenditure increased 1.2%, due to a:
- 2.3% increase in household consumption. Leading the rise were transport services (36.7%), health (5.1%), and hotels, cafes and restaurants (7.7%).
Partly offset by a:
- 1.5% decrease in government expenditure led by a fall in state and local government (-2.9%) due to reduced spending on non-employee expenses.
Private gross fixed capital formation decreased 2.7%, driven by a:
- 10.9% decrease in non-dwelling construction due to higher disposals of assets to the public sector and weaker new engineering construction.
- 3.8% decrease in total dwellings investment reflecting weakness in new and used dwellings due to labour constraints and materials shortages.
Partly offset by a:
- 8.6% increase in machinery and equipment led by the delivery of vehicles and agricultural machinery and investment into information technology infrastructure.
Public gross fixed capital formation increased 9.6%, driven by a:
- 10.0% increase in general government with strength in state and local (14.9%) due to increased investment in buildings. Second hand assets acquired from the private sector also contributed to the rise.
- 7.1% increase in total public corporations led by strength in state and local (9.6%) from dwelling investment.

Total final consumption expenditure increased 1.5%, driven by a:
- 2.2% increase in household consumption led by strength in recreation and culture (8.3%), hotels, cafes and restaurants (10.3%) and transport services (34.8%) as tourism activity picked up over the quarter. Health rose 4.3% as elective surgeries and allied health services rebounded from the impacts of the Omicron wave in March quarter.
Partly offset by a:
- 0.1% decrease in government expenditure, as national expenditure fell (-0.4%) following a strong March quarter due to flood related assistance.
Private gross fixed capital formation fell 2.4%, driven by a:
- 6.0% fall in total dwellings as labour and material constraints along with wet weather impacted work done on new and used dwellings, as well as alterations and additions.
- 6.0% fall in total non-dwelling construction led by a fall in new-engineering construction and higher disposals of assets to the public sector.
Partly offset by a:
- 6.0% rise in total machinery and equipment driven by increased investment from the mining, construction and agriculture industries.
Public gross fixed capital formation increased 4.1% driven by a:
- 4.6% increase in state and local general government driven by second hand assets from the private sector.
- 8.8% increase in national general government due to a rise in spending on defence assets.

Total final consumption expenditure increased 0.8%, due to a:
- 1.4% increase in household consumption driven by strength in transport services (54.4%) due to reopened borders and air transport, as well as rises from clothing and footwear (8.7%) and recreation and culture (2.4%). Western Australia was the only state to record a fall in household spending on health (-2.9%) as a result of COVID-19 precautionary measures.
Partly offset by a:
- 0.6% decrease in government expenditure driven by a fall of 1.0% in state and local spending. This follows two strong quarters of expenditure related to spending on the health sector.
Private gross fixed capital formation decreased 1.4%, due to a:
- 6.5% fall in total non-dwelling construction due to weakness in new engineering construction from project completions.
- 5.6% fall in intellectual property products led by a decrease in petroleum exploration expenditure.
Partly offset by a:
- 6.7% increase in total machinery and equipment driven by continued investment from the mining sector to boost production at existing sites.
Public gross fixed capital formation decreased 3.3%, driven by a:
- 9.4% decrease in state and local general government due to a fall in investment in road infrastructure and machinery and equipment.
- 3.2% decrease in state and local public non-financial corporations reflecting less work done on transport infrastructure.
Partly offset by a:
- 11.3% increase in national general government reflecting a rise in spending on defence assets and buildings.
Total final consumption expenditure increased 1.8%, driven by a:
- 1.5% increase in household consumption driven by strength in hotels, cafes and restaurants (9.5%), transport services (35.1%) and clothing and footwear (8.3%).
- 2.5% increase in government expenditure led by a 4.5% rise in state and local spending in areas such as health and transport.
Private gross fixed capital formation increased 1.3%, driven by a:
- 3.1% increase in total non-dwelling construction with increases across both new buildings and new engineering construction.
- 3.2% increase in total dwellings reflecting an increase in both new dwellings and alterations and additions.
Partly offset by a:
- 3.7% decrease in ownership transfer costs due to a fall in stamp duties.
Public gross fixed capital formation fell 2.4%, driven by a:
- 11.1% decrease in state and local general government following strength in prior quarters from the education sector.
Partly offset by a:
- 17.4% increase in state and local public corporations led by strength in utilities.
- 11.3% increase in national general government due to a rise in spending on defence assets and university infrastructure.
Total final consumption expenditure increased 0.5%, due to a:
- 1.4% increase in household consumption. Leading the rise were hotels, cafes and restaurants (8.3%), recreation and culture (5.8%) and transport services (17.1%). Also contributing to the rise was a rebound in household spending on health (4.5%) and increased consumption of electricity, gas and other household fuels (8.7%).
Partly offset by a:
- 1.4% decrease in government expenditure driven by weakness in state and local government (-2.6%) across both employee and non-employee expenses.
Private gross fixed capital formation decreased 0.1%, driven by a:
- 7.6% decrease in total dwellings led by weakness in new and used dwellings as work done on new houses retreats from elevated levels in 2021.
- 5.4% fall in ownership transfer costs due to a slow down in the property market.
Partly offset by a:
- 8.2% increase in non-dwelling construction driven by new buildings.
Public gross fixed capital formation increased 2.9%, driven by a:
- 4.4% increase in state and local public corporations due to investment in utilities.
- 5.3% rise in national general government reflecting a rise in spending on defence assets.
Total final consumption expenditure decreased 2.1%, driven by a:
- 6.2% decrease in government expenditure, led by a 10.0% decrease in state and local expenditure due to a fall in COVID-19 related spending.
Partly offset by a:
- 1.4% increase in household consumption driven by rises in transport services (70.7%), hotels, cafes and restaurants (9.1%), recreation and culture (3.6%) and operation of vehicles (9.6%) due to the absence of travel restrictions over the full quarter.
Private gross fixed capital formation increased 5.2%, driven by a:
- 5.5% increase in non-dwelling construction driven by new engineering work.
- 14.5% increase in total dwellings driven by a strong rebound in alterations and additions.
Partly offset by a:
- 7.4% decrease in machinery and equipment due to reduced expenditure on mining equipment.
Public gross fixed capital formation increased 4.3%, driven by a:
- 34.6% increase in state and local public corporations driven by increased investment in utilities.
Total final consumption expenditure increased 0.2%, driven by a:
- 1.4% increase in household consumption due to rises in hotels, cafes and restaurants (4.4%), transport services (18.9%) and health (5.0%).
Partly offset by a:
- 0.6% decrease in government expenditure due to a 1.6% fall in national spending.
Private gross fixed capital formation increased 1.8%, driven by a:
- 6.6% increase in total dwellings led by strength in work done on other dwellings such as apartments and townhouses.
- 6.1% increase in total non-dwelling construction led by an increase in new buildings.
Partly offset by a:
- 8.2% decrease in total machinery and equipment due to a fall in vehicle purchases.
Public gross fixed capital formation increased 3.6%, driven by a:
- 3.4% increase in national general government reflecting a rise in spending on defence assets.
Related Articles


