
Australian Gross Domestic Product rose +3.1 per cent in seasonally adjusted chain volume terms in the December quarter 2020, according to figures released by the ABS today.
Head of National Accounts at the ABS, Michael Smedes said: “The economy has continued to recover with activity increasing 3.1 per cent in the December quarter following the 3.4 per cent rise in September quarter. However, despite the two consecutive quarters of strong growth, economic activity remained 1.1 per cent lower than recorded in the 2019 December quarter.”
This is the first time in the over sixty year history of the National Accounts that GDP has grown by more than 3.0 per cent in two consecutive quarters.
State by State GDP
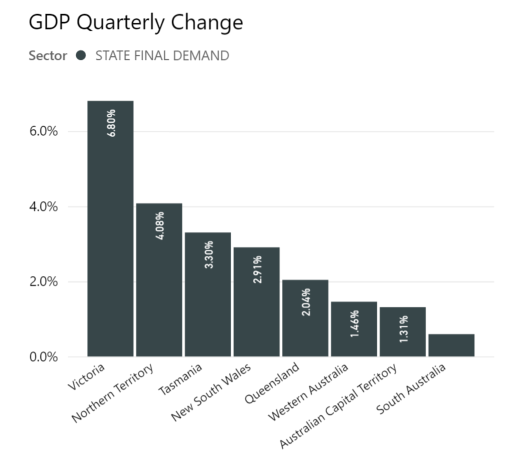
On a State by State basis, an analysis of the latest GDP numbers reveal the extent of the COVID comeback across the country, with Victoria showing the strongest gain over the quarter, but still insufficient to bring the State into positive annual growth.
GDP Growth by State
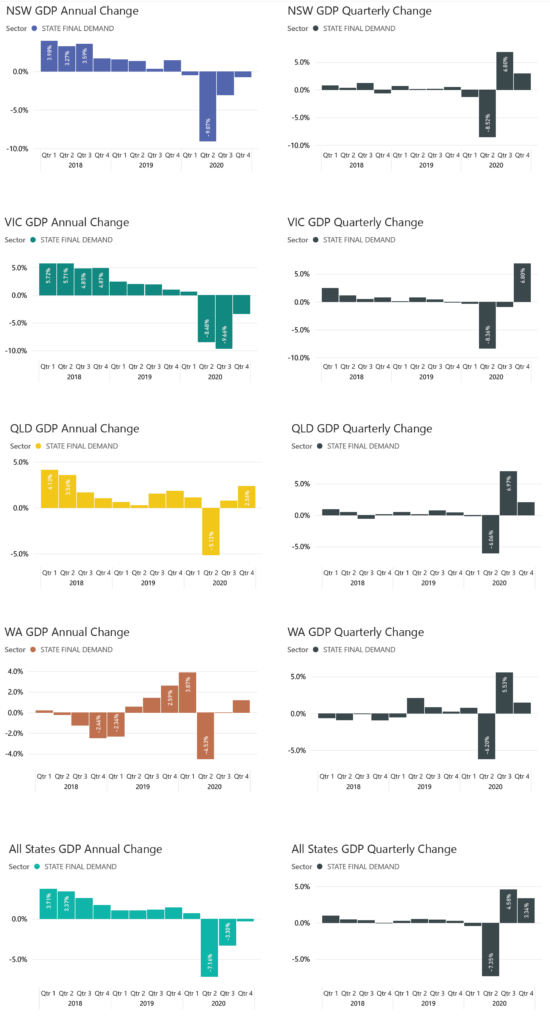
On an annual basis, the States with limited COVID lock down were obviously less impacted. The smaller economies of the Northern Territory, ACT and Tasmania continue to surge with strong Private Investment and Household expenditure.
Queensland has performed exceptionally well recording an annual growth rate of 2.3%, despite the obvious COVID impacts to tourism and the hard border closures.
Our graphic below shows the annual change and the quarterly changes for each of the States over the past 3 years.
State Final Demand by Quarter
New South Wales + 2.9%
Total final consumption expenditure increased 2.7%, driven by a:
- 3.1% increase in household consumption, reflecting the continued recovery in expenditure on recreation and culture, hotels, cafes and restaurants, and operation of vehicles
- 1.5% increase in government consumption with a rise in social benefits to households driven by increased aged care payments
Private gross fixed capital formation increased 4.2%, due to a:
- 17.6% increase in machinery and equipment driven by increased vehicle purchases across a range of industries
- 18.2% increase in ownership transfer costs following continued easing of COVID-19 restrictions and low levels of activity earlier in the year
Partly offset by a:
- 5.2% decrease in non-dwelling construction due to a continued decline in new building activity
Public gross fixed capital formation increased 2.2%, driven by a:
- 4.6% increase in state and local general government reflecting increased work on road and rail infrastructure
Partly offset by a:
- 7.0% decrease in state and local public corporations, driven by project completions
Victoria +6.8%
Household final consumption expenditure increased 10.4%, driven by easing COVID-19 restrictions, which led to rises in:
- Recreation and culture, clothing and footwear, other goods and services, hotels, cafes and restaurants, purchase of vehicles, and health
Government final consumption expenditure increased 0.8%, driven by a:
- 2.5% increase in national non-defence general government FCE with increased university employee expenses, and increased Commonwealth aged care payments
Private gross fixed capital formation increased 5.1%, driven by a:
- 16.3% increase in machinery and equipment, reflecting increased purchases of vehicles across a number of industries, as well as agricultural equipment
- 3.0% increase in total dwelling investment driven by investment in new houses supported by the HomeBuilder stimulus
Public gross fixed capital formation increased 1.5%, driven by a:
- 2.4% rise in state and local general government, reflecting increased investment in road and rail infrastructure and health
- 6.2% increase in Commonwealth public non-financial corporations
Queensland +2.0%
Total final consumption expenditure increased 1.3%, due to a:
- 2.3% increase in household consumption expenditure led by the continued recovery in expenditure on hotels, cafes and restaurants, purchase of vehicles, operation of vehicles, and other goods and services
Partly offset by a:
- 1.2% decrease in government expenditure
Private gross fixed capital formation increased 4.9%, due to a:
- 9.6% increase in dwelling investment following increased approvals and supported by the HomeBuilder stimulus
- 27.8% increase in ownership transfer costs consistent with increased activity in the property market
Public gross fixed capital formation increased 4.1%, due to a:
- 8.1% increase in state and local general government driven by increased work on road and rail infrastructure projects
Partly offset by a:
- 6.7% decrease in state and local public corporations as a result of project completions
South Australia +0.6%
Total final consumption expenditure increased 0.7%, driven by a:
- 0.9% increase in household consumption led by increased expenditure on operation of vehicles, purchase of vehicles, other goods and services, and hotels, cafes and restaurants
- 0.1% increase in government FCE with increased Commonwealth spending on aged care which was partly offset by reduced defence and state and local expenditure
Private gross fixed capital formation decreased 1.5%, driven by a:
- 15.6% decrease in non-dwelling construction, reflecting lower engineering and building construction across industries
Partly offset by an:
- 8.8% rise in machinery and equipment, reflecting greater purchases in Mining and other industries
Public gross fixed capital formation increased 6.1%, driven by a:
- 10.1% rise in state and local general government, reflecting increased investment in education and health
- 18.8% increase in Commonwealth public non-financial corporations driven by investment in naval infrastructure
Western Australia +1.5%
Total final consumption expenditure increased 1.5%, due to a:
- 4.4% increase in government consumption expenditure driven by increases in social benefits to households. The state government’s electricity rebate contributed to the rise.
- 0.3% increase in household consumption expenditure led by increased expenditure on other goods and services, hotels, cafes and restaurants, purchase of vehicles, and operation of vehicles. This was partly offset by a fall in electricity, gas and other fuels with the decline in out of pocket expenditure.
Private gross fixed capital formation increased 1.5%, driven by an:
- 8.9% increase in dwelling investment following increased approvals and support from state policies and the Commonwealth HomeBuilder stimulus
- 19.6% increase in ownership transfer costs consistent with increased activity in the property market
Partly offset by a:
- 6.0% decrease in machinery and equipment, particularly in the Mining and Construction industries
Public gross fixed capital formation increased 1.3%, driven by a:
- 2.6% increase in public corporations, spread across levels of government
Related Articles


